Shiny Dev and Software Release Cycles and Rayshader, Oh My!
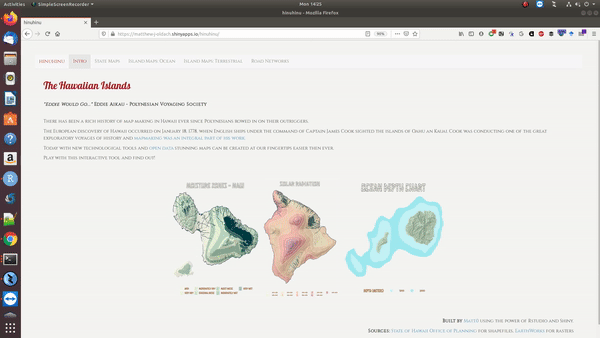
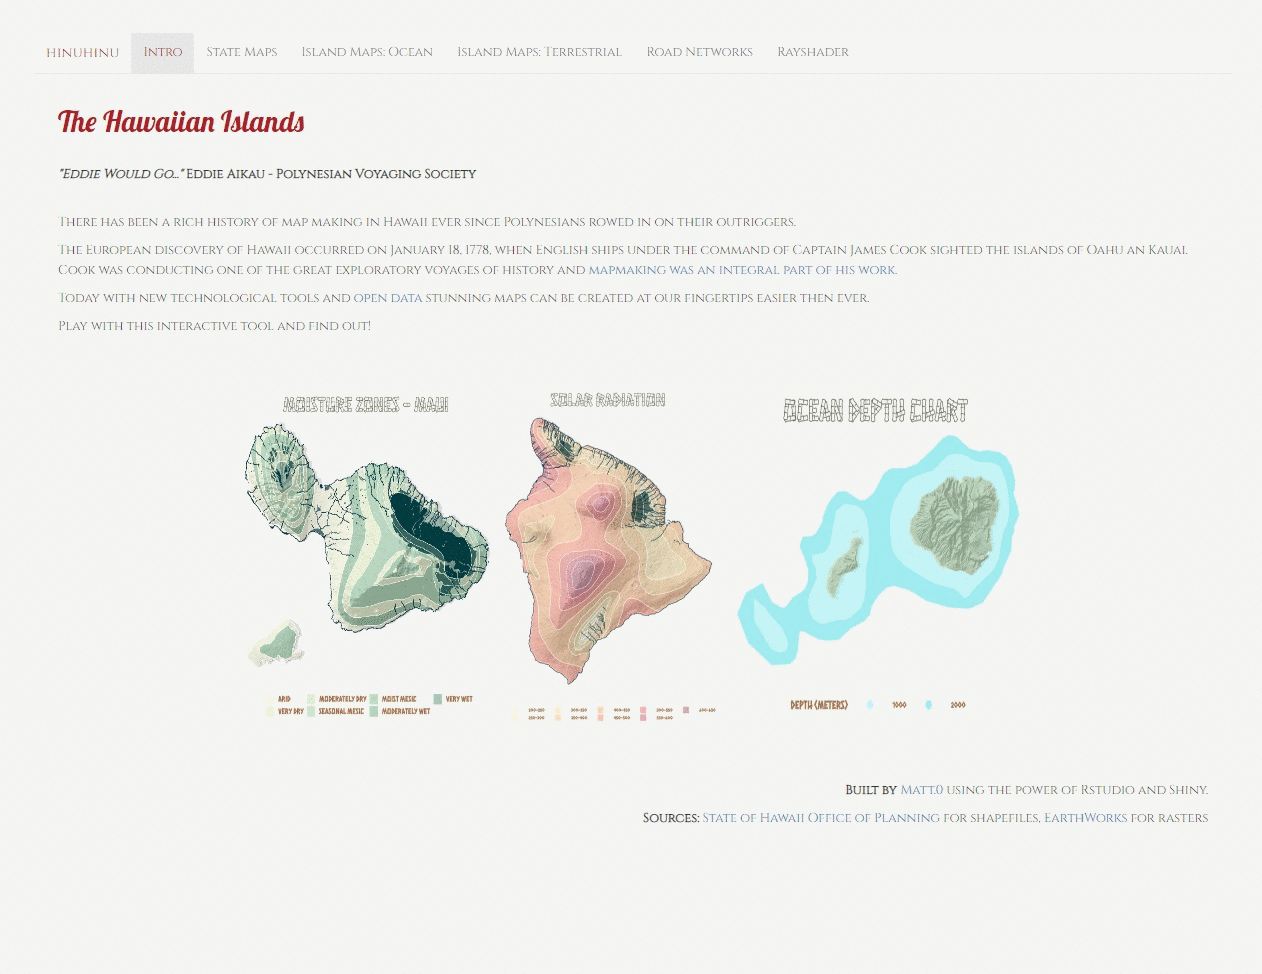
CLICK HERE TO GO TO THE SHINY APPLICATION!!!
Inspiration for the Shiny Application
You can read as much theory as you want but the best way to learn something is to pull-up your sleeves and get your hands dirty by implementing a project.
I’ve been wanting to develop a Shiny application for sometime but the opportunity has never arisen. In my current role as a R developer, I provide client-side implementations via Java with the help of the RServe 📦 - so Shiny isn’t needed. Well, if the opportunity doesn’t present itself on the job it’s time for a side-project!
I wasn’t exactly sure what kind of project I should do until I saw a blog post by Timo Grossenbacher on bivariate maps with ggplot2 and sf.
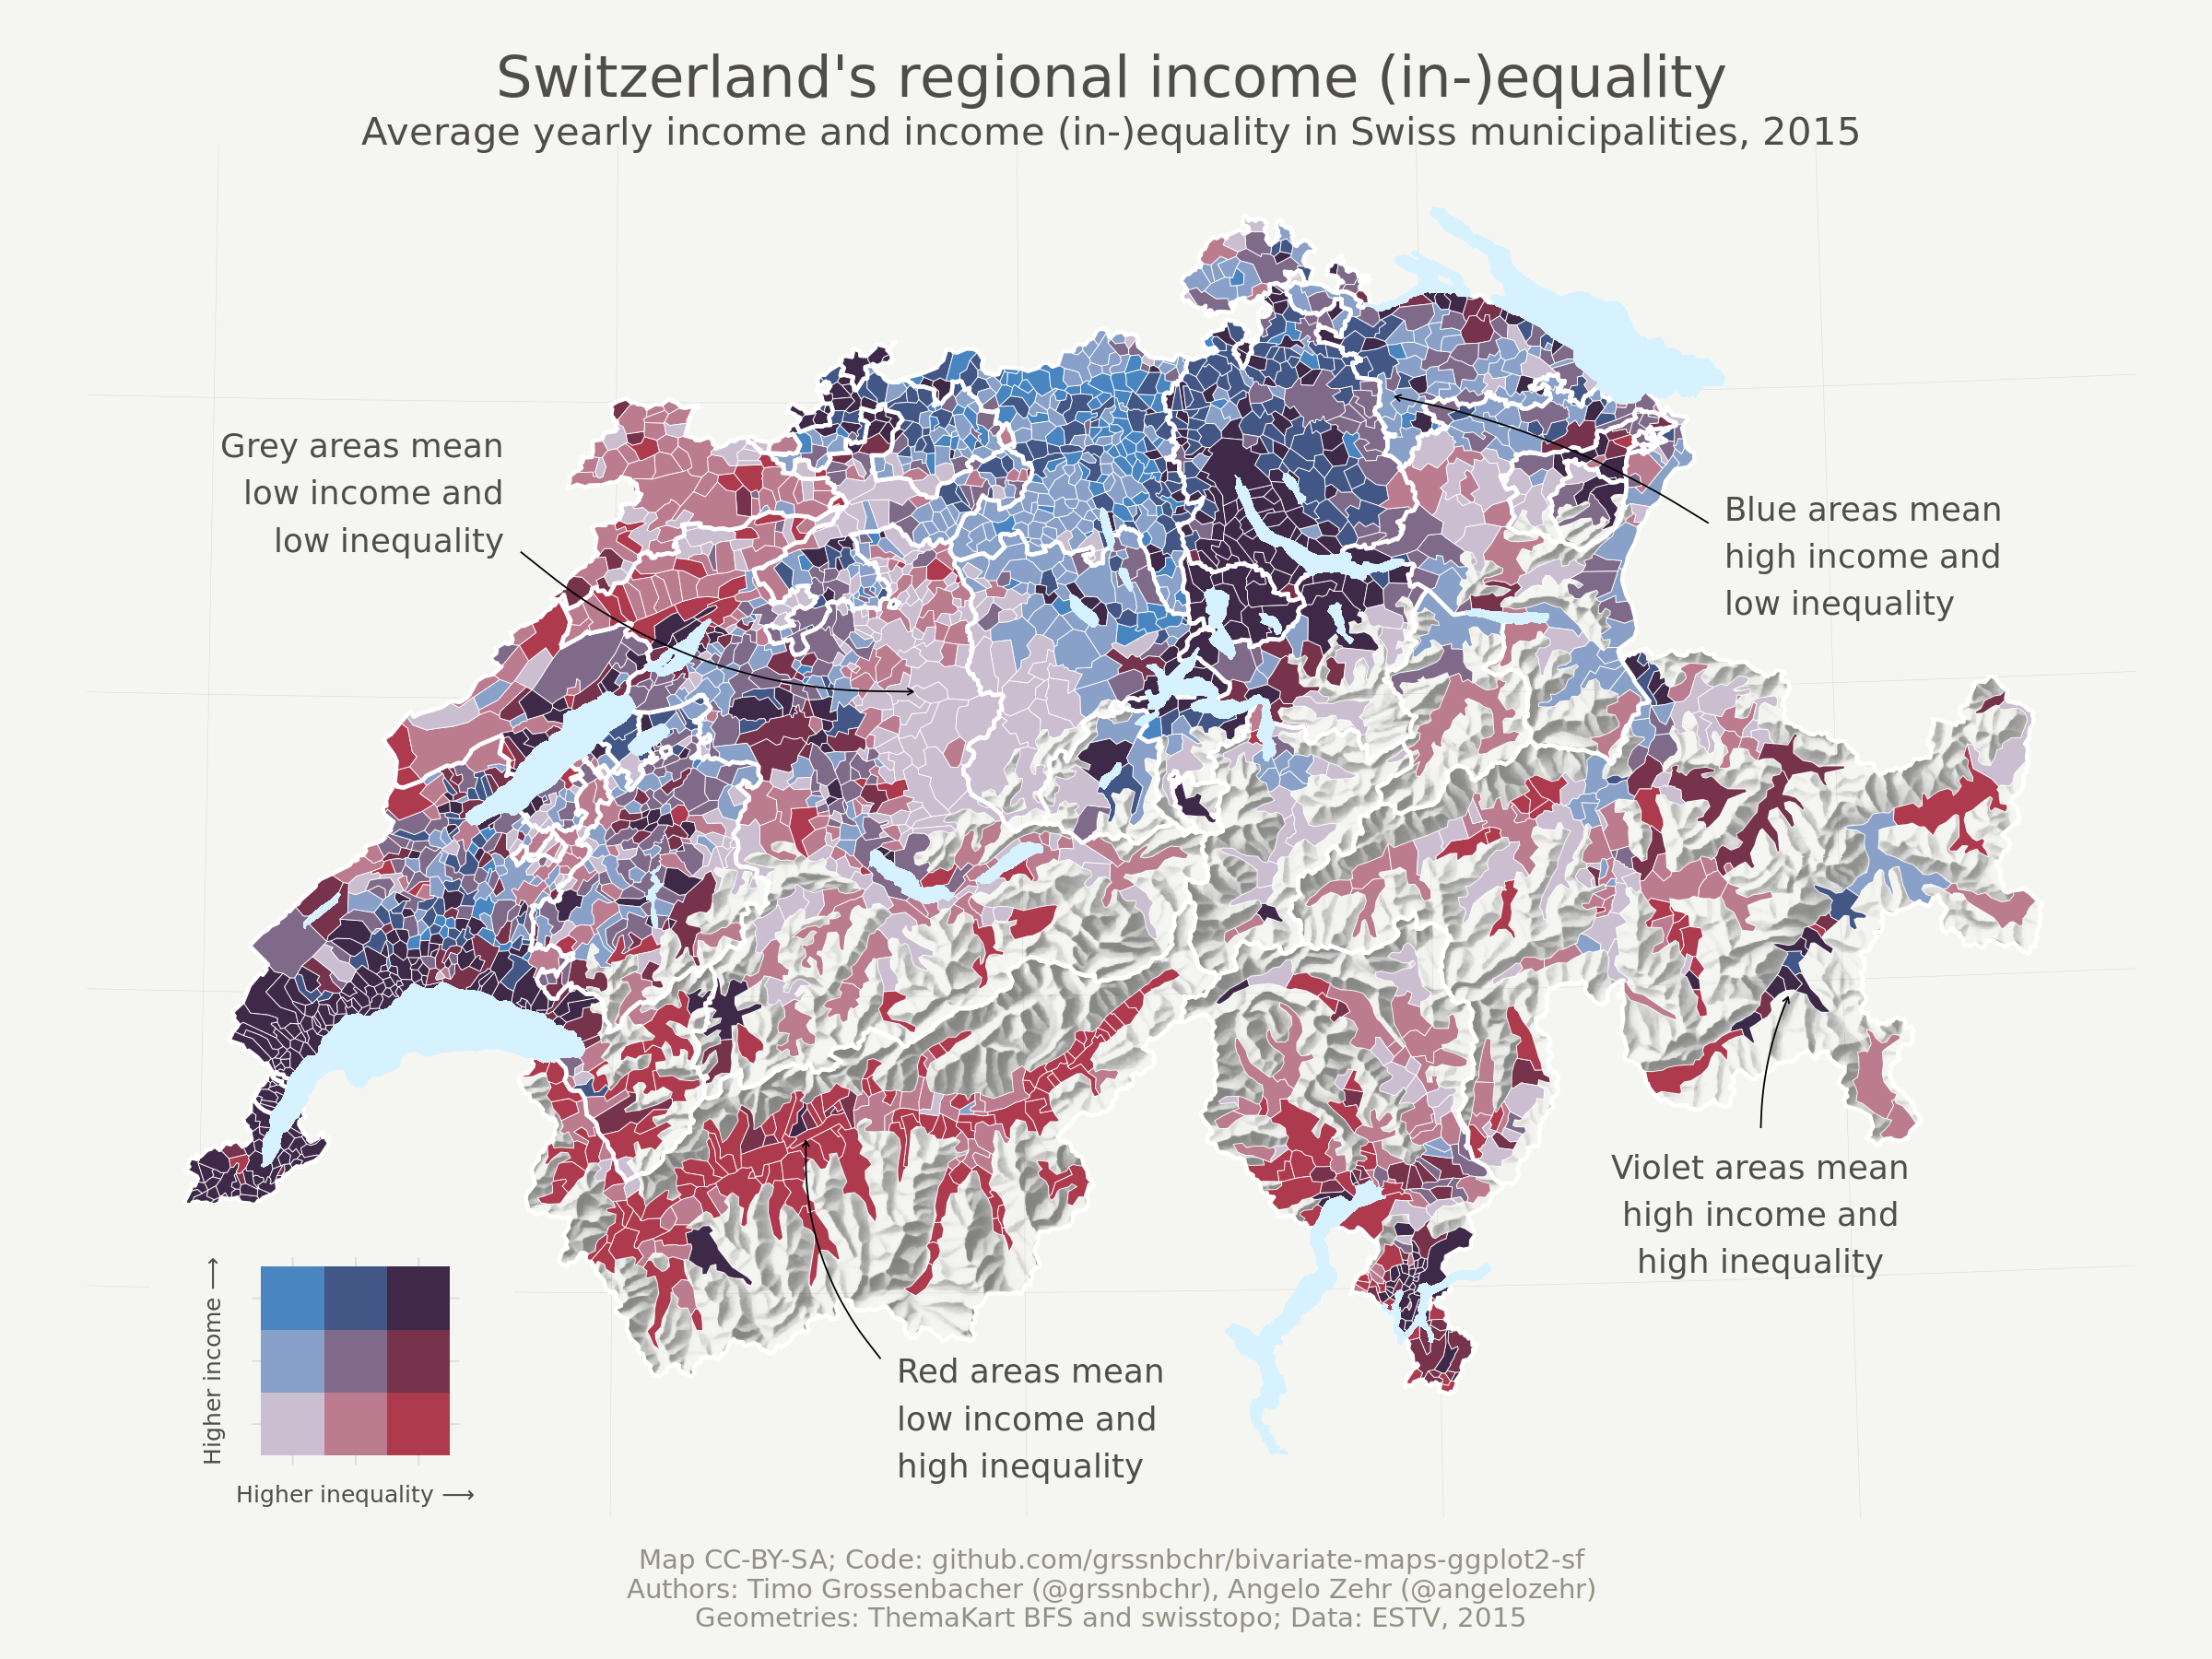
The map shows income (in-)equality in Switzerland at the municipality level by visualizing two variables at the same time. What instantly attracted me was the beautiful relief of the mountainous Swiss landscape. It’s not something I’ve seen much from ggplot2 maps - something usually reserved for GIS programs. I thought creating an application for geography would be a fun and engaging use of a Shiny application. My current role as a developer for a web-application that enables complex meta-analysis and visualization caters to biologists rather than specilazied bioinformaticians- NetworkAnalyst.ca. I thought it might be cool to do a similar thing for people who aren’t GIS specialist (or even familiar with R) and enable them to quickly create maps and save them (either as PNGs or PDFs)?
One of the intial challenges was finding a good dataset. I had wanted to do a project on my home province of Alberta but eventually settled on Hawaii instead for a couple reasons. One is that I could find relief’s for the State of Hawaii in two levels of detail: 100m and 200m. The second was the State of Hawaii also provides a large number of shapefiles which I could lay overtop of the relief. The amount of open data available to Hawaii attractive, and the fact that they are islands presented certain opportunities… and challenges, as well.
I wanted to provide users with a range maps. I wanted maps at different scales and with different contexts such as focusing on the marine environment or the terrestrial enviornment. I wanted maps covering the whole state of Hawaii, others showing individual islands (or groups of islands), and others giving the user a view of the city level. It was here that I got inspiration from Erin Davis’s beautiful street maps in “The Beatiful Hidden Logic of Cities - Worldwide”.
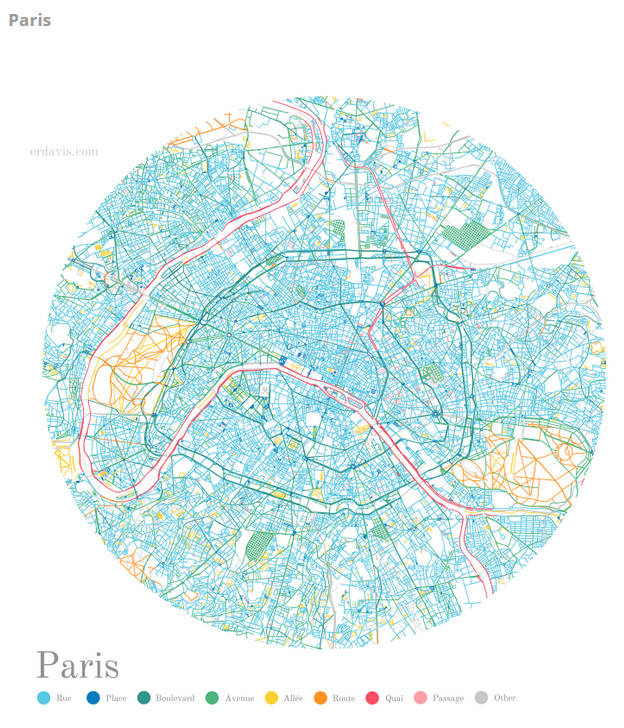
Erin’s legend looked great! Unfortunately she didn’t have a programatic way to generate these labels, she did them in Adobe Photoshop (personal correspondence). I tried to write some code to generate labels programattically using key_glyph = "point" to set sf object glyphs as points and then use the override.aes trick to get circles (like in this SO post post) but I didn’t like the look. To be honest lables are something that could still use work in the ggplot2 world IMO 🤷
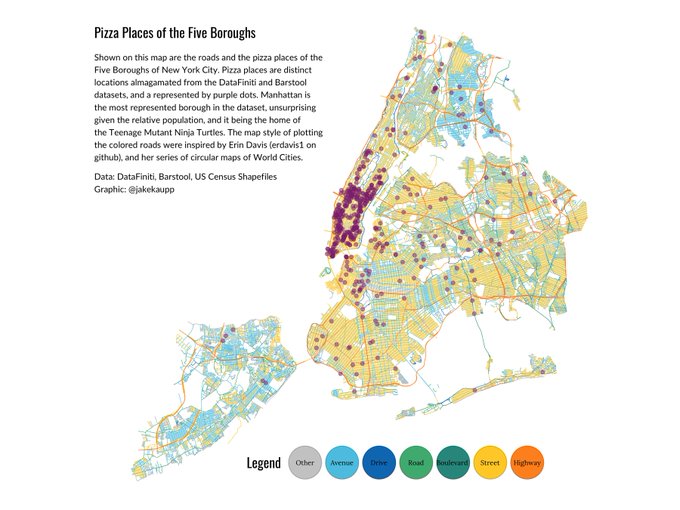
Jake Kaupp did a #TidyTuesday submission for Week #40: Pizza Party! showing all of the pizza spots in the five-boroughs and came up with a nice way of constructing a color legend with ggplotGrob() as well as a neat use of colorspace::darken():
For Shiny UI inspiration I looked towards some of the winners of the 1st ever Shiny Contest (something I hope RStudio brings back next year!). I can’t express how much I learn from reading other peoples code and for this particular application I was heavily inspired by the David Smale’s, winner of “Best Design”, 69 Love Songs: A Lyrical Analysis. What was really cool was it was hosted on the RStudio cloud so I could go in and change things and see how it affected which for me was one of the coolest ways to grok Shiny.
Building the application
Getting back to elevation reliefs for a second. Before I learned that you could easily get Digital Elevation Model (DEM) data from mapzen via the {`geoviz’} 📦, I used QGIS to subset the reliefs. Here’s a screencast of the process:
For the shapefiles, sometimes it was simple to subset the geom_sf() object via a column with island information (Hawaii, Maui, Oahu, Kauai) using dplyr::filter(). However, when there was no information I also used QGIS to subset the shapefiles.
Note: I’m positive there is a way to do this via a bounding-box in
RI just never learned how… please send me a message and I’ll update this if you know a way! Here’s a video of how I did it with QGIS:
This project was a great learning experience not only for learning Shiny & Spatial Mapping, but also learning a bit more about the development cycle of a “production” applcation is like. It’s kind of like the ol’ aphorism “Perfect is the eney of good” - you want to get your appltion out to the public ASAP. I released the app as soon as I had tested for bugs and thought the UI was good-enough.
After its release, I wanted to add a new feature - Rayshader!, Rayshader is one of the hot-new tools in The Landscape of Spatial Data Analysis in R. Historically geographic information had always been presented in the form of two-dimensional maps, all the way from cave walls, parchment to computer screens. Because spatial information is inherently 3D, it makes sense that the tools available today are allowing 3D depictions of geographical data to escape the realm of mere novelty. With Rayshader you can control things like the lighting, camera tilt, and angle of view which provides an engaging experience for the audience.
I was signed up for Tyler Morgan-Wall’s (the developer of Rayshader) Penn State MUSA Masterclass: 3D Mapping and Visualization with R and Rayshader the next month (the awesome talk is here and the Git repo is here) and wanted to spend a bit of time to demo the package before taking the class.
I came up with some very plain “desert”-y looking maps of Hawaii:
Although I had wanted to allow the user to interact with the 3D maps, I ran into issues where the application attempted to use more memory then was avialable under the free-tier plan of Shinyapps.io. The RStudio documentation on debugging your application’s section on Memory wa useful for figuring this out as it suggests looking in the application’s logs for 2019-11-18T15:12:16.088451+00:00 shinyapps[system]: Out of memory!. I settled on providing the “fly-by” videos innstead.
After attending Tyler’s class I wanted to update my application again by including a satellite overlay; I spent some time figuring out the best way to do this, modifying the easing function and rayshader::render_movie() parameters to make longer videos, testing it out, and then using rsconnect::deployApp() to re-deploy my application.
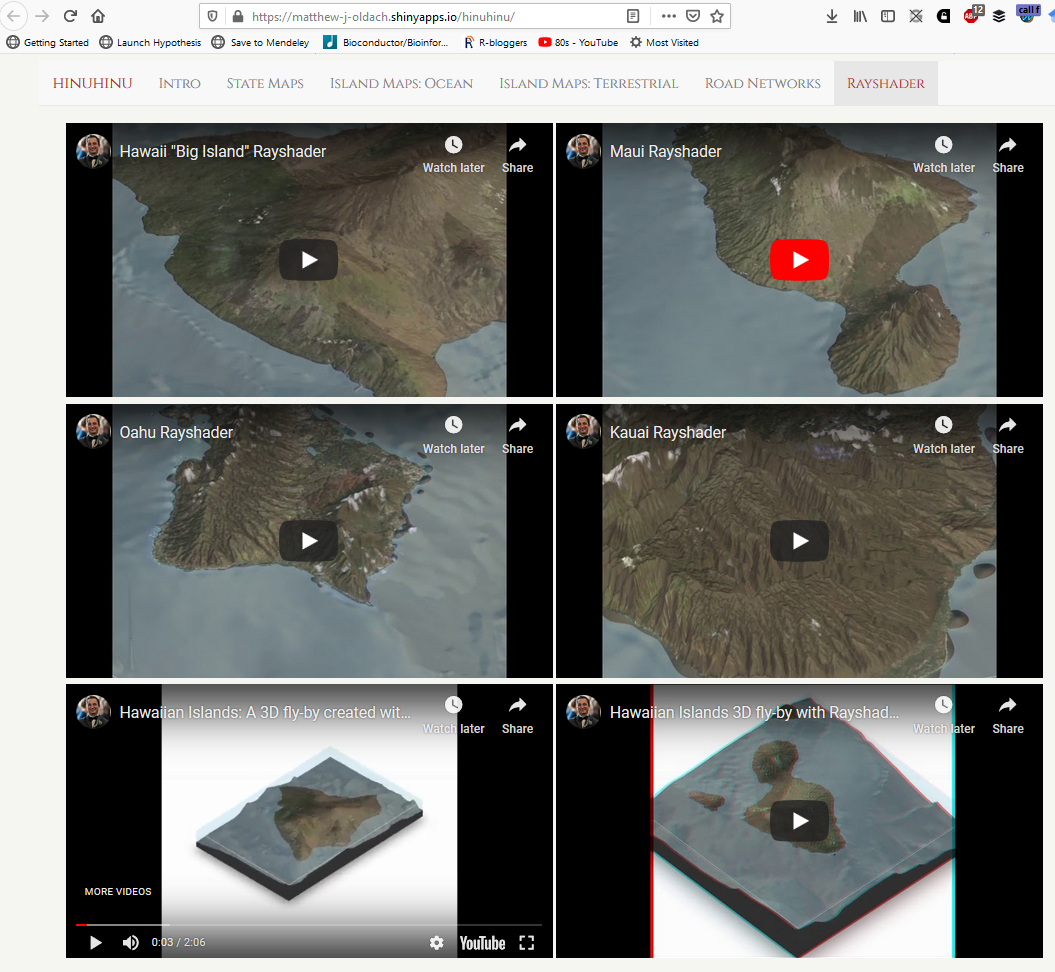
I decided to merge all four videos together using VSCD Video Editor and overlaid some a musical track. Although Tyler promised Rayshader would have VR/AR capabilities in the near-future, I simply couldn’t wait so I also made another version of the video with a steroscopic 3D effect for viewing with red and cyan anaglyph 3D glasses:
Future Directions/Things Learned/General Musings
I’m not planning on developing this specific application any further as I’m quite happy with the final outcome. This project was mainly to learn:
- Shiny
- Spatial Mapping
- Software release life cycles
From talking with my father he told me that software he worked on with IBM would be released with ~2000 known bugs.
“Better a diamond with a flaw than a pebble without” - Confucius
It’s important to keep track of tasks, enhancements, and bugs for your project:
Note: Those scrupulous enough to peer into my repo will have found that I do not always follow my own advice…
Now theoretically let’s say I was building this application for a client and they just had to have! interactive 3D visualizations produced with Rayshader (something I’m not sure if Shiny is ideal for anyways) you could pay for a higher tier in Shinyapps.io to get a performance boost (i.e. more RAM 🐏).
Another thing that I may have wanted to do if my application was more complex is to provide the user with a tour using the {cicerone} 📦 like what one sees on the excellent tour of the iSEE Shiny interface.
After 75 commits I’m pretty tired, so I didn’t include any code snippets here (BTW you can find all the code on Github). Full-disclosure: the 75 commtis (and code) are currently split between two-repositories and I feel a bit of shame for that…

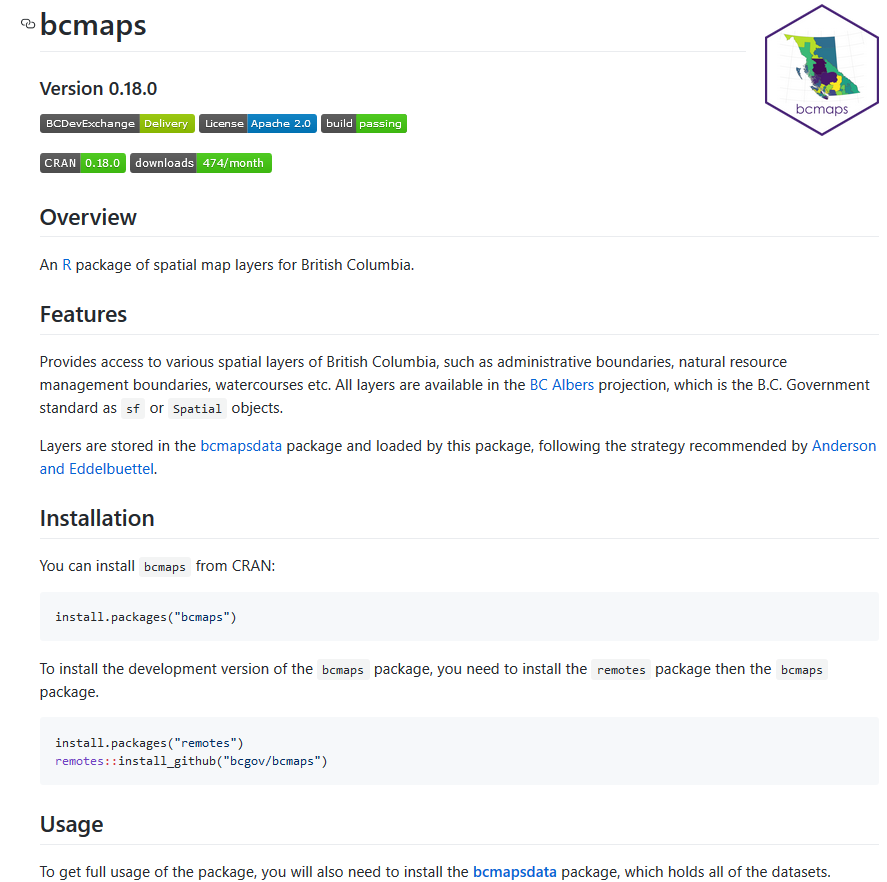
But there is a reason for this. I had intially started off the [mahalo] repository because I wanted to create package like the {bcmaps} 📦 but for Hawaii (I may still if there is enough interest from the community, but at the moment this is on-hold).
Along with this, I also wanted to create a Showcase/Companion for the package with Shiny that would give users a run-through.
I wasn’t sure what the “best practices” for this are: do you keep the app with the package or do you have a seperate repo? I reached out to John Coene ([@jdatap](https://twitter.com/jdatap)), because he’s an all-around nice guy (and also Swiss), and he suggested keeping them seperate if the application is large (adivce I followed) and to also use {golem} (advice which I did not follow - I still think it’s a great idea and I’ll consider for my next app though!).
I still need to spend some time figuring out how to supply datasets as I ran into issues with my project. I knew that I wouldn’t be able to just drop all of the shapefiles into my git repo because Github is meant for code and not data. I also knew that you could acclerate ggplot2 by using a canvas to speed up rendering plots so I thought to myself “If I’m just developing a map package I can generate”basemaps" as .Rds objects and then use those in my hinuhin repository to overlay other shapefiles on-top of". Even though I avoided including most of the GIS information by producing these basemaps I had to set up a free account with Git Large File Storage to include the shapefiles I overlaid in this project and that took up 80% of my quota.
One way I had heard of dealing with this was either by hosting on a server: either, an internal server (means the Shiny application can only be used within an organization and not the general public) or hosting the data on the cloud (e.g. Amazon S3). Still other packages have dealt with this issue by accessing web-hosted databases via HTTP requests to APIs - which is well and good if the data is already available from an online database (it was not)
The bcmaps package handels data in a way proposed by G. Brooke Anderson & Dirk Eddelbuettel ([@eddelbuettel](https://twitter.com/eddelbuettel)), via a drat repository which allows a recommended maximum size of 1GB - I may have to look into this option if the Twitterverse is interested in a package for maps of Hawaii.
Brief thought on the future of Rayshader
There are a number of companies today trying to map out city streets to create high-quality 3D maps for self-driving cars and projection projects (see: The Race to Map the World in 3D):
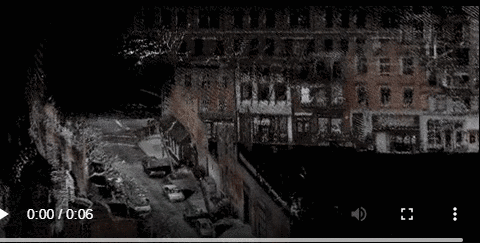
Image: Carmera
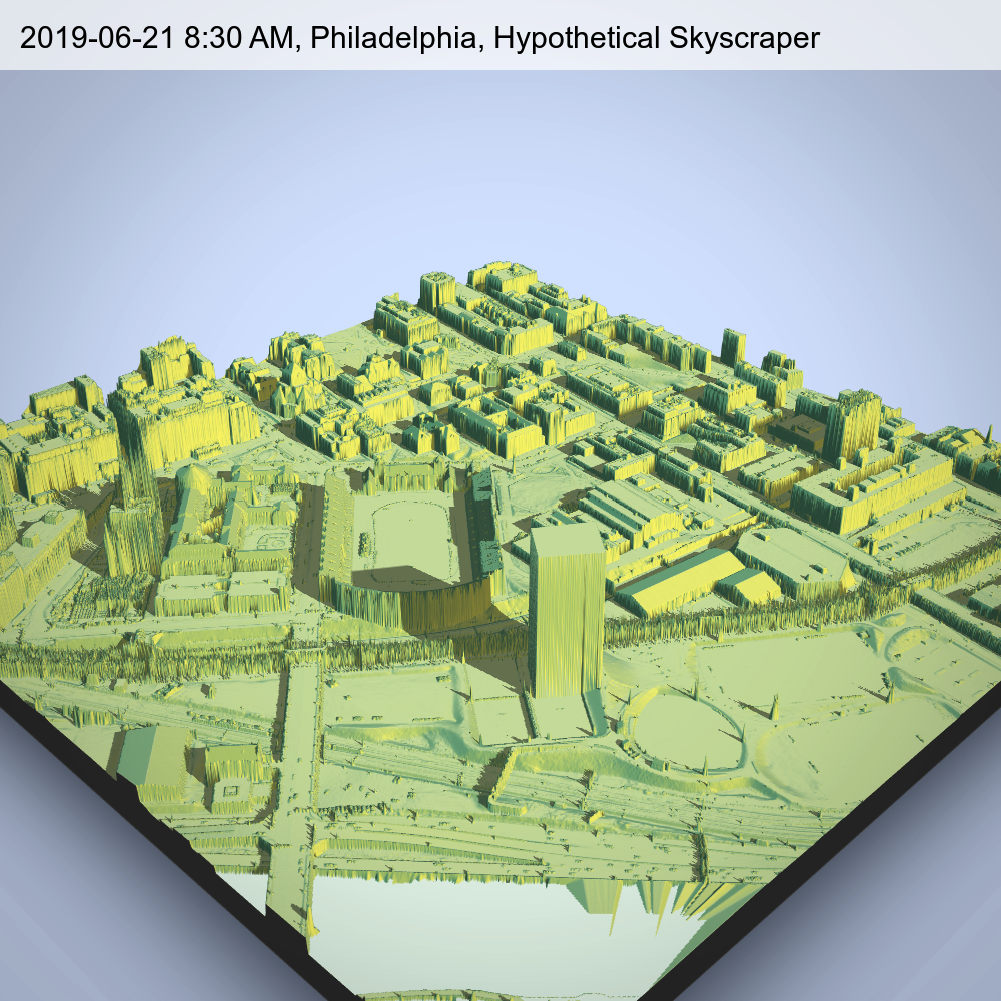
Getting access to this kind of data would be awesome because it would mean you could overlay high-quality images over LIDAR like this one produced by Tyler of Philadelphia:
If you missed it at the top you can CLICK HERE TO GO TO MY SHINY APPLICATION DEPLOYMENT!!!
Matthew J. Oldach, M.Sc.
Senior Consultant and Team Lead
I am an experienced professional in Bioinformatics, Software Development, Data Science and DevOps. With a diverse skill set, I excel in various technical areas such as data wrangling, statistical modeling, machine learning, shiny, data visualization, report automation, code optimization, AWS, Docker, and workflow orchestrators.